python confusion matrix plot
python confusion matrix plot
내가 자주사용하는 차트
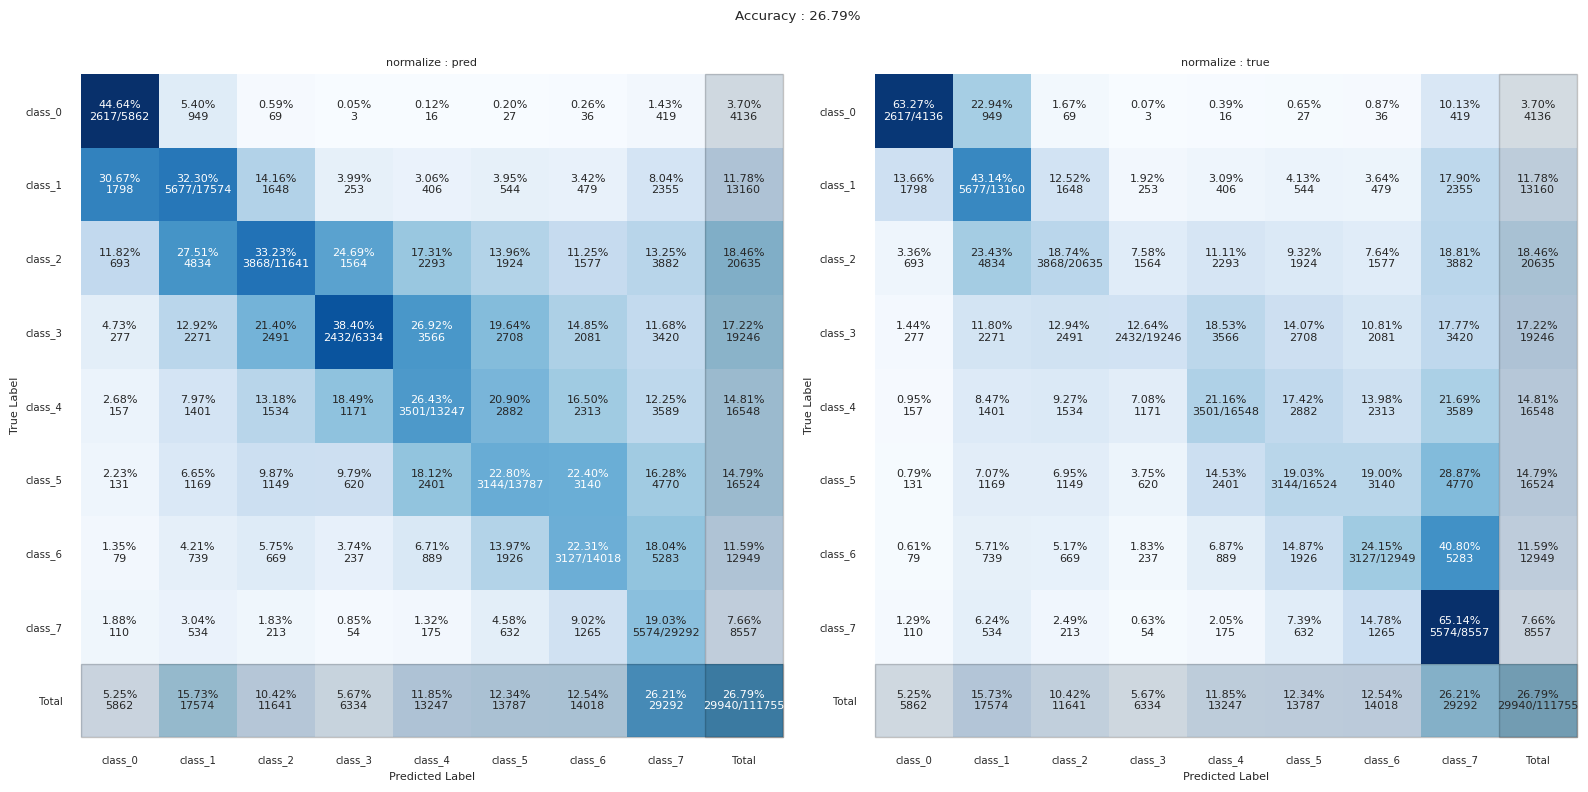
Confusion Matrix Plot
1
2
3
4
5
6
7
8
9
10
11
12
13
14
15
16
17
18
19
20
21
22
23
24
25
26
27
28
29
30
31
32
33
34
35
36
37
38
39
40
41
42
43
44
45
46
47
48
49
50
51
52
53
54
55
56
57
58
59
60
61
62
63
64
65
66
67
68
69
70
71
72
73
74
75
76
77
78
79
80
81
82
83
84
85
86
87
88
89
90
91
92
93
94
95
96
97
98
99
100
101
102
103
104
105
106
107
108
109
110
111
112
113
114
115
116
117
118
119
120
121
122
123
124
125
126
127
128
129
130
131
132
133
134
135
136
137
138
139
140
141
142
143
144
145
146
147
148
149
import numpy as np
import pandas as pd
import seaborn as sns
import matplotlib.pyplot as plt

from matplotlib.patches import Rectangle
from matplotlib.ticker import PercentFormatter
from sklearn.metrics import confusion_matrix, accuracy_score


def cm_analysis(y_true, y_pred, labels, classes, figsize=(16, 8), save_path=None, vmax=False):

    sns.set(font_scale = figsize[1] / len(classes) / 1.5)
    fig, (ax1, ax2) = plt.subplots(ncols=2, figsize=figsize)

    ####################################################################################################
    # pred
    cm = confusion_matrix(y_true, y_pred)
    cm_sum = np.sum(cm, axis=0, keepdims=True)
    cm_perc = cm / cm_sum.astype(float) * 100
    cm = np.c_[cm, cm.sum(1)]
    cm = np.r_[cm, [cm.sum(0)]]

    annot = np.empty_like(cm).astype(str)
    nrows, ncols = cm.shape
    for i in range(len(labels)):
        for j in range(len(labels)):
            c = cm[i, j]
            p = cm_perc[i, j]
            if i == j:
                s = cm_sum[0][i]
                annot[i, j] = '%.2f%%\n%d/%d' % (p, c, s)
            elif c == 0:
                annot[i, j] = ''
            else:
                annot[i, j] = '%.2f%%\n%d' % (p, c)

    freq = confusion_matrix(y_true, y_pred)
    acc_1 = list(freq.sum(1) / len(y_true) * 100)
    acc_0 = list(freq.sum(0) / len(y_true) * 100)
    acc_0.append(np.sum(np.diag(freq)) / len(y_true) * 100)

#     for i in range(len(labels)):
#         c = cm[i, -1]
#         annot[i, -1] = '%d' % (c)
#     for j in range(len(labels)):
#         c = cm[-1, j]
#         annot[-1, j] = '%d' % (c)
    for i, p in enumerate(acc_1):
        c = cm[i, -1]
        annot[i, -1] = '%.2f%%\n%d' % (p, c)
    for j, p in enumerate(acc_0):
        c = cm[-1, j]
        annot[-1, j] = '%.2f%%\n%d' % (p, c)
    annot[-1, -1] = '%.2f%%\n%d/%d' % (acc_0[-1], np.sum(np.diag(freq)), len(y_true))

    cm = confusion_matrix(y_true, y_pred, normalize='pred')
    cm = pd.DataFrame(cm, columns=labels)
    cm = cm * 100
    cm["Total"] = acc_1
    cm.loc["Total"] = acc_0
    cm.index.name = 'True Label'
    cm.columns.name = 'Predicted Label'
    if vmax:
        sns.heatmap(cm, annot=annot, fmt='', ax=ax1, cbar=False, cbar_kws={'format':PercentFormatter()}, cmap="Blues", vmin=0, vmax=vmax)
    else:
        sns.heatmap(cm, annot=annot, fmt='', ax=ax1, cbar=False, cbar_kws={'format':PercentFormatter()}, cmap="Blues")
    ax1.set_title("normalize : pred")
    ax1.set_xticklabels(classes+["Total"], rotation=0)
    ax1.set_yticklabels(classes+["Total"], rotation=0)

    x, y, w, h = 0, len(classes), len(cm.columns), 1
    for _ in range(2):
        ax1.add_patch(Rectangle((x, y), w, h, fill=True, fc=(0,0,0,0.1), ec=(0,0,0,0.2), lw=1, clip_on=False))
        x, y = y, x
        w, h = h, w

    ####################################################################################################
    # true
    cm = confusion_matrix(y_true, y_pred, labels=labels)
    cm_sum = np.sum(cm, axis=1, keepdims=True)
    cm_perc = cm / cm_sum.astype(float) * 100
    cm = np.c_[cm, cm.sum(1)]
    cm = np.r_[cm, [cm.sum(0)]]

    annot = np.empty_like(cm).astype(str)
    nrows, ncols = cm.shape
    for i in range(len(labels)):
        for j in range(len(labels)):
            c = cm[i, j]
            p = cm_perc[i, j]
            if i == j:
                s = cm_sum[i]
                annot[i, j] = '%.2f%%\n%d/%d' % (p, c, s)
            elif c == 0:
                annot[i, j] = ''
            else:
                annot[i, j] = '%.2f%%\n%d' % (p, c)

    freq = confusion_matrix(y_true, y_pred)
    acc_1 = list(freq.sum(1) / len(y_true) * 100)
    acc_0 = list(freq.sum(0) / len(y_true) * 100)
    acc_0.append(np.sum(np.diag(freq)) / len(y_true) * 100)

    for i, p in enumerate(acc_1):
        c = cm[i, -1]
        annot[i, -1] = '%.2f%%\n%d' % (p, c)
    for j, p in enumerate(acc_0):
        c = cm[-1, j]
        annot[-1, j] = '%.2f%%\n%d' % (p, c)
    annot[-1, -1] = '%.2f%%\n%d/%d' % (acc_0[-1], np.sum(np.diag(freq)), len(y_true))

    cm = confusion_matrix(y_true, y_pred, labels=labels, normalize='true')
    cm = pd.DataFrame(cm, index=labels, columns=labels)
    cm = cm * 100
    cm["Total"] = acc_1
    cm.loc["Total"] = acc_0
    cm.index.name = 'True Label'
    cm.columns.name = 'Predicted Label'

    if vmax:
        sns.heatmap(cm, annot=annot, fmt='', ax=ax2, cbar=False, cbar_kws={'format':PercentFormatter()}, cmap="Blues", vmin=0, vmax=vmax)
    else:
        sns.heatmap(cm, annot=annot, fmt='', ax=ax2, cbar=False, cbar_kws={'format':PercentFormatter()}, cmap="Blues")
    ax2.set_title("normalize : true")
    ax2.set_xticklabels(classes+["Total"], rotation=0)
    ax2.set_yticklabels(classes+["Total"], rotation=0)

    x, y, w, h = 0, len(classes), len(cm.columns), 1
    for _ in range(2):
        ax2.add_patch(Rectangle((x, y), w, h, fill=True, fc=(0,0,0,0.1), ec=(0,0,0,0.2), lw=1, clip_on=False))
        x, y = y, x
        w, h = h, w

    ####################################################################################################
    plt.tight_layout()

    accuracy = accuracy_score(y_true, y_pred)
    plt.suptitle("Accuracy : {:>.2%}".format(accuracy))
    plt.subplots_adjust(top=0.9)


    if save_path:
        plt.savefig(save_path)
    else:
        plt.show()

    plt.close()
    sns.set(font_scale = 1)
test code
1
2
3
4
5
6
7
8
9
10
11
12
13
14
15
16
17
18
19
20
21
22
23
y_true = np.random.randint(0, 8, 10000)
y_pred = np.random.randint(0, 8, 10000)
labels=list(range(8))
classes = [f"class_{i}" for i in labels]
figsize=(16, 8)
cm_analysis(
y_true=y_true,
y_pred=y_pred,
labels=labels,
classes=classes,
figsize=figsize,
vmax=False,
)
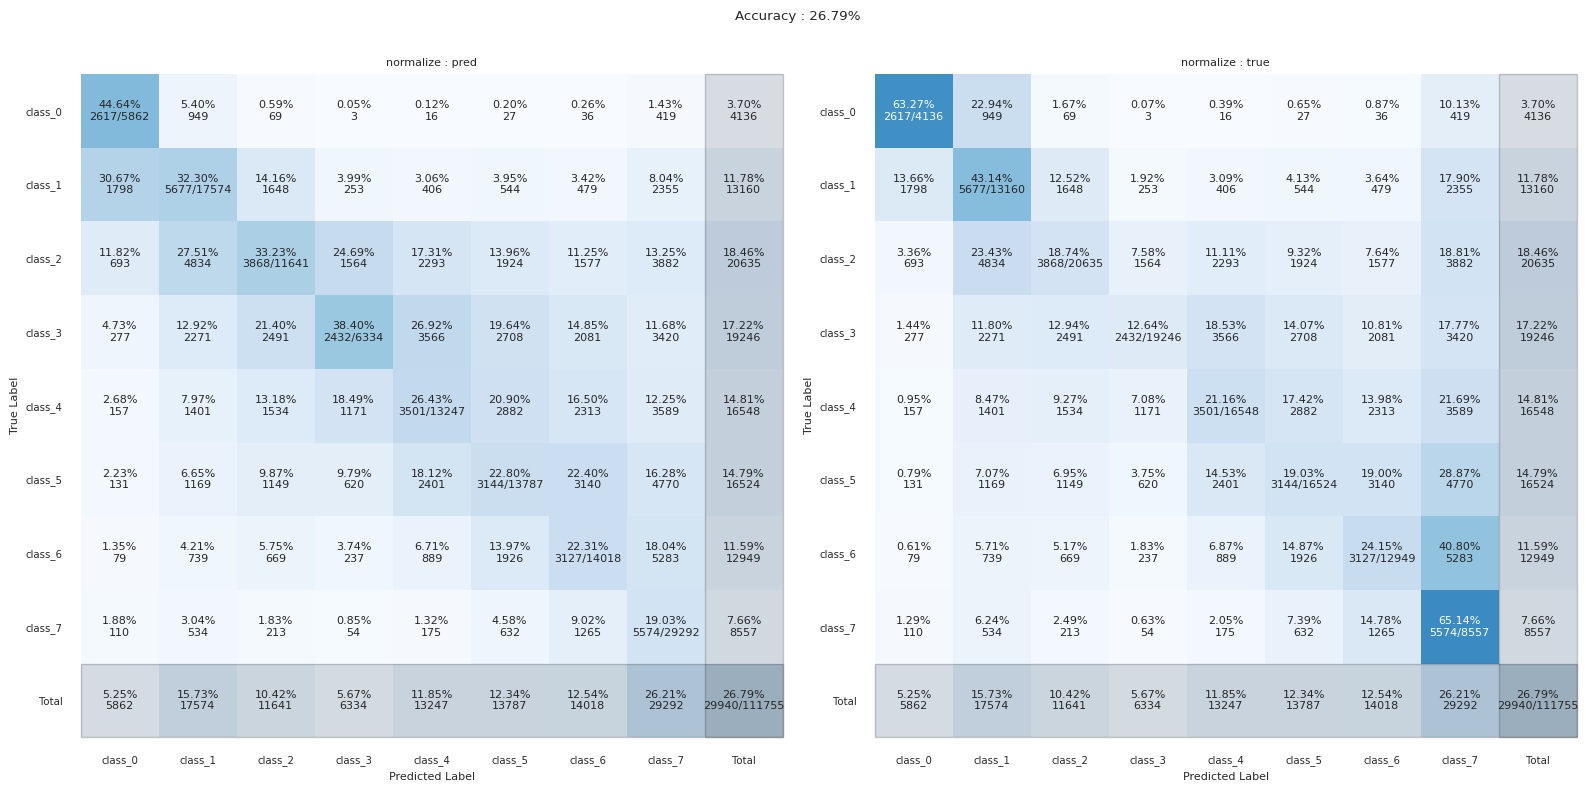
cm_analysis(
y_true=y_true,
y_pred=y_pred,
labels=labels,
classes=classes,
figsize=figsize,
vmax=100,
)
Referrence
- https://gist.github.com/hitvoice/36cf44689065ca9b927431546381a3f7#file-plot_confusion_matrix-py
- https://stackoverflow.com/questions/62533046/how-to-add-color-border-or-similar-highlight-to-specifc-element-of-heatmap-in-py
이 기사는 저작권자의 CC BY 4.0 라이센스를 따릅니다.